
Solar vs Electricity Bill: What You Save Over 25 Years
Grid electricity costs compound over decades. See how rooftop solar stacks up against staying on the utility — with real 25-year savings math for homeowners in 2026.
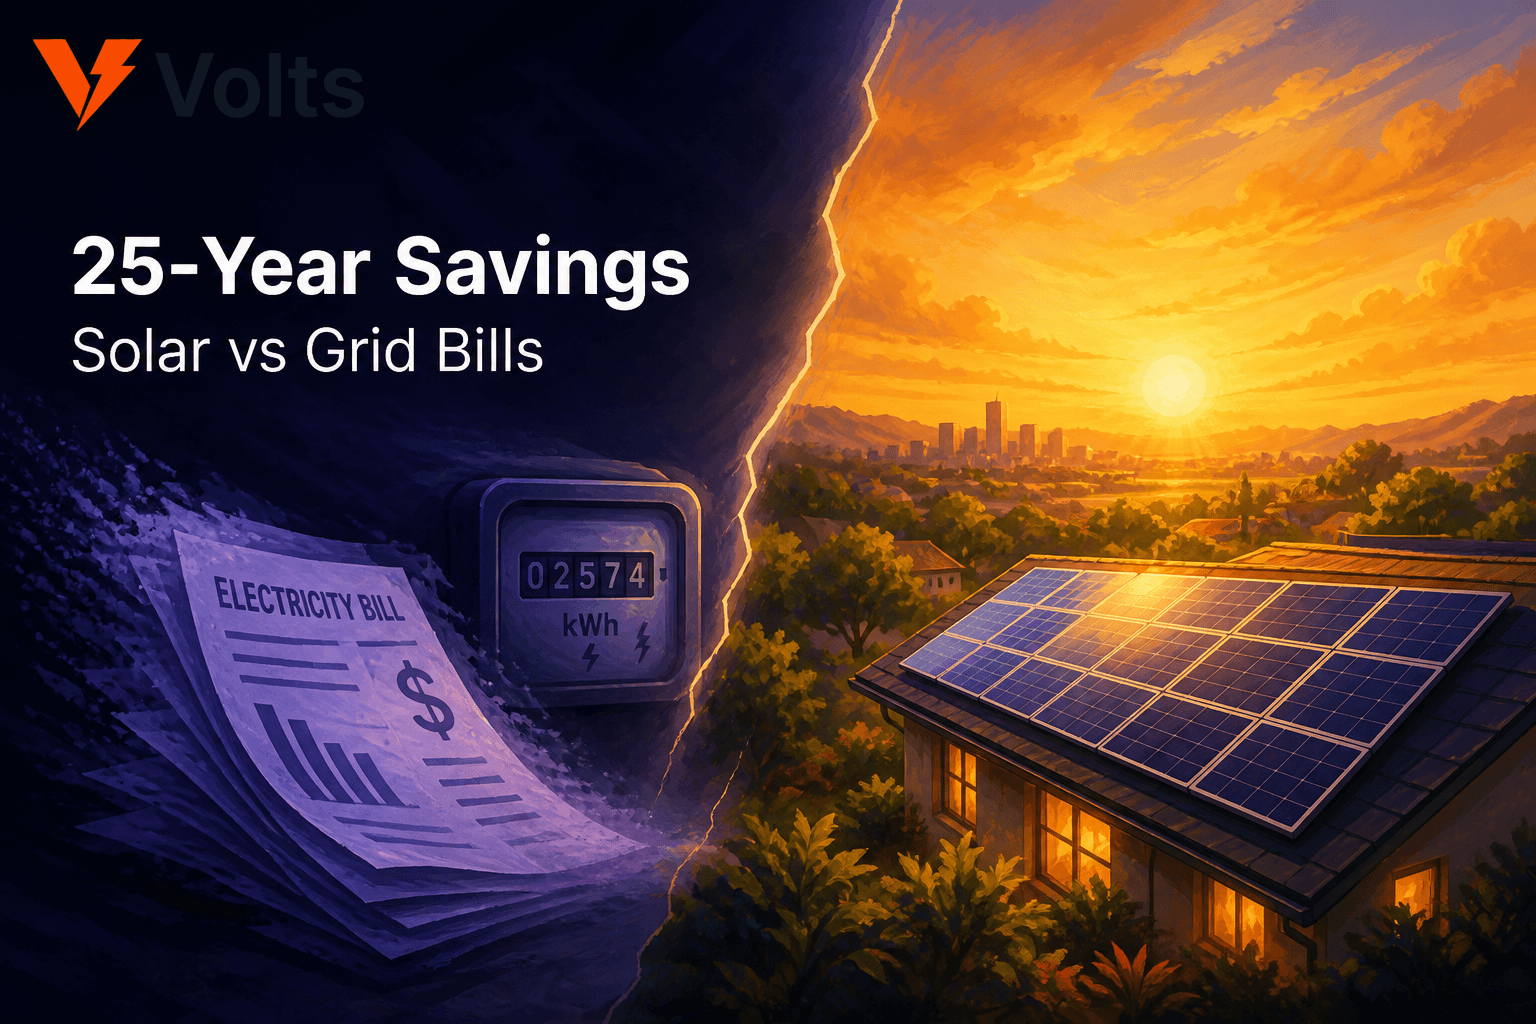
Most people think about solar as "lower bill next month." The bigger picture is twenty-five years of electricity — because that is how long your panels are designed to perform.
Comparing solar vs staying on the grid over a full system lifetime usually shows six figures of difference in high-rate regions. The gap widens every time your utility raises tariffs.
Key takeaway: Solar wins on lifetime cost when (bill savings + export) × 25 years far exceeds net install cost — even after the US federal ITC ended for purchases in 2026.
The grid path: paying forever
When you stay fully on grid, you rent power every month. There is no equity — only escalating bills.
Simplified model for a home using 10,000 kWh/year:
| Year | Bill at $0.18/kWh flat | Bill at 4% annual rate increase |
|---|---|---|
| 1 | $1,800 | $1,800 |
| 10 | $1,800 | $2,664 |
| 20 | $1,800 | $3,943 |
| 25 | $1,800 | $4,799 |
25-year total (with 4% rises): roughly $70,000+ — and you own nothing at the end.
Real tariffs are messier (time-of-use, fixed charges, demand fees), but the direction is universal: grid power gets more expensive over time.
The solar path: upfront cost, then decades of cheap power
A 8 kW system might produce ~10,000–12,000 kWh/year depending on location.
| Phase | What happens |
|---|---|
| Years 0–1 | Pay install cost (cash or finance) |
| Years 1–8 | Savings approach payback |
| Years 8–25 | Majority of production is net positive cash flow |
If net install cost is $18,000 and average annual benefit is $2,200 (bill offset + export):
- Payback: ~8 years
- Years 9–25 savings: ~$37,400 (undiscounted)
- Minus inverter replacement (~year 12–15): budget $2,000–$4,000
Still far ahead of grid-only in most sunbelt US, UK, and Australian homes.
Self-consumption vs export — why usage pattern matters
Every kWh you use while the sun shines avoids buying at retail rate (often $0.20–$0.40).
Exported kWh may earn only $0.03–$0.12 depending on SEG, NEM 3.0, or feed-in tariffs.
| Behaviour | Effect on 25-year savings |
|---|---|
| Work from home, run AC midday | High self-consumption — stronger savings |
| Empty house all day | More export at lower rates — weaker unless battery |
| Battery + solar | Shifts evening load to stored solar — can restore export-era economics |
Learn how solar works on your roof
Solar vs grid — side by side (illustrative)
Assumptions: 10,000 kWh/year usage, 8 kW solar, $20,000 gross install, $2,000 incentives, 4% grid inflation.
| Grid only (25 yr) | Solar (25 yr) | |
|---|---|---|
| Total energy spend | ~$70,000+ | ~$18,000 net + ~$8,000 finance/insurance/maintenance |
| Asset at year 25 | None | Working system (possibly one inverter swap) |
| Exposure to rate hikes | 100% | Partial — only on night/imported kWh |
Your spreadsheet will differ. The shape of the comparison is what matters: solar front-loads cost; grid never stops billing.
When grid-only still makes sense
- Very low consumption (small flat, mild climate)
- Moving within payback window without recouping via home value
- Unfixable shading making production uneconomic
- Landlord who will not approve install
Even then, efficiency upgrades (heat pumps, LED, insulation) may beat solar per dollar.
Lease and PPA vs owning the savings
Third-party owned systems (lease/PPA) trade lower upfront for shared savings — the provider keeps incentives and you pay per kWh produced.
Compare 25-year contract cost vs owned system lifetime savings before signing. Ownership usually wins if you can finance or pay cash — especially post-2026 US ITC changes on purchases.
Hidden grid costs people forget
Grid bills include more than energy charges:
- Fixed daily supply charges (Australia, UK) — solar reduces kWh portion but rarely eliminates standing charges
- Demand charges (some US commercial-rate schedules on large homes)
- Time-of-use peaks — evening peaks hit harder without battery
- Future carbon or capacity surcharges — policy-dependent but trending up in many markets
Solar does not eliminate connection fees, but it shrinks the variable portion that grows with inflation.
Year-by-year mental model
| Period | Grid-only household | Solar household |
|---|---|---|
| Years 1–5 | Full rising bills | High install/loan cost, falling bills |
| Years 6–10 | Still full bills | Approaching or past payback |
| Years 11–25 | Cumulative grid spend accelerates | Mostly free kWh minus maintenance |
The crossover where cumulative solar cost drops below cumulative grid cost is your true breakeven — slightly later than simple payback if grid inflation is high, because grid path gets worse every year you wait.
Environmental value (secondary benefit)
Lifetime CO₂ avoided depends on grid mix — coal-heavy grids see larger offsets. Financial savings remain the primary decision driver for most homeowners, but reduced emissions are a meaningful co-benefit in Australia, parts of the US, and Asia-Pacific grids still transitioning.
Frequently asked questions
What if I only stay 10 years?
Owned solar can still net positive via bill savings; home sale may recapture remaining asset value if buyers value lower running costs.
Does solar eliminate my bill completely?
Rarely — night usage, standing charges, and winter shortfalls keep a reduced bill unless oversized system + battery.
How does degradation affect 25-year savings?
Panels lose ~0.5%/year output — model 80–88% of year-one production by year 25. Good quotes include degradation assumptions.
Model your 25-year picture
Generic tables cannot see your bill curve. Use the Volts calculator to project savings over the system lifetime, then lock in numbers with installer quotes on the same production assumptions.
Related: Solar payback period · Solar panel cost 2026
Next step: Compare lifetime savings →
Ready to see your numbers?
Get up to 3 free quotes from verified solar installers, 100% free for homeowners.
Calculate My Savings